When a Blue PillPriceAliExpress price stops in HardFault_Handler, the instruction that caused the fault is usually elsewhere in the program. In this esp32.co.uk/ guide, you will record the Cortex-M3 exception frame and fault status registers, then use the exact firmware ELF to find the saved instruction. The STM32F103C8PriceAliExpress price lab deliberately executes an undefined Thumb instruction, so you can verify the entire diagnostic path before using it on an intermittent failure.
The recorder preserves the original stack pointer before switching to a small emergency stack. It checks the candidate frame before dereferencing it and copies memory fault addresses only when the hardware marks them valid. It then stops for inspection over SWD. Use the recorded evidence to distinguish a precise fault from escalation, a bad vector fetch or a fault during stacking.
Establish which exception occurred
A fault can change what the debugger shows before you have a chance to read the cause. By the time the core is running the HardFault handler, its current program counter points into that handler. The stacked program counter belongs to the interrupted context. The two addresses can be many functions apart. Begin with the recorded frame and use the live PC to tell whether the recorder has finished. A breakpoint on the handler can show entry, but a breakpoint after the capture gives the complete evidence.
The Cortex-M3 has configurable MemManage, BusFault and UsageFault exceptions. A fault can escalate to HardFault if its configurable handler is disabled or cannot be taken at the current execution priority. HFSR.FORCED indicates escalation. The underlying reason is recorded in CFSR. In the deliberate test, the UsageFault handler is disabled and the undefined instruction should set CFSR.UNDEFINSTR and HFSR.FORCED. HFSR.VECTTBL instead points toward a fault during a vector table read. ST Cortex-M3 programming manual PM0056
| Evidence | Question it helps answer |
|---|---|
| HFSR | Was there escalation or a vector table read fault? |
| CFSR | Which configurable fault reasons were recorded? |
| SHCSR | Which configurable handlers were enabled or active? |
| EXC_RETURN | Which stack supplied the saved frame? |
| Stacked PC and xPSR | Where was the interrupted context and what state did it have? |
| BFAR and MMFAR | Which access address was recorded, if valid? |
Fault bits can remain set until cleared by a write of one or by reset. Preserve the raw values before experimenting with clears. A clean reset between intentional tests makes the new bits easier to identify. Several set bits can describe a sequence of failures or leftover evidence, so the full register word is more useful than a single label printed by a debugger. When logging a fault outside the lab, keep the build identifier and the conditions that produced it with the raw words.
Record the stage of execution when the fault happened. A failure on the first peripheral access after boot suggests a different investigation from one that follows an hour of network traffic. The same saved PC may be reached through several callers. Note whether the fault follows a reset, an interrupt, a particular input or a transition into another firmware image. A reproducible sequence and the last known good transaction can narrow the context before you start reading disassembly.
For a failure that only appears with the debugger disconnected, check what the debugger changes before comparing runs. Some debug configurations freeze watchdogs or timers while the core is halted. A debugger can also catch an exception before the handler executes its first instruction. Those differences can change whether you see a capture or a reset. Repeat the deliberate fault once with normal free-running execution, then attach or halt to read the record if your setup supports it. Record the debug configuration alongside the test. A result that depends on the debugger is still useful evidence about timing or startup, provided the condition is stated.
Keep the raw capture small enough to inspect in the memory window. For example, record both the candidate frame address and the copied PC. If the copied PC looks suspect, you can examine the original eight words while the core is halted and compare them with the saved record. The original memory may have been overwritten by the application before the crash or by exception entry itself. Treat disagreement as another symptom. Avoid automatically trusting whichever readout happens to look closer to the expected source line.
Find the basic exception frame
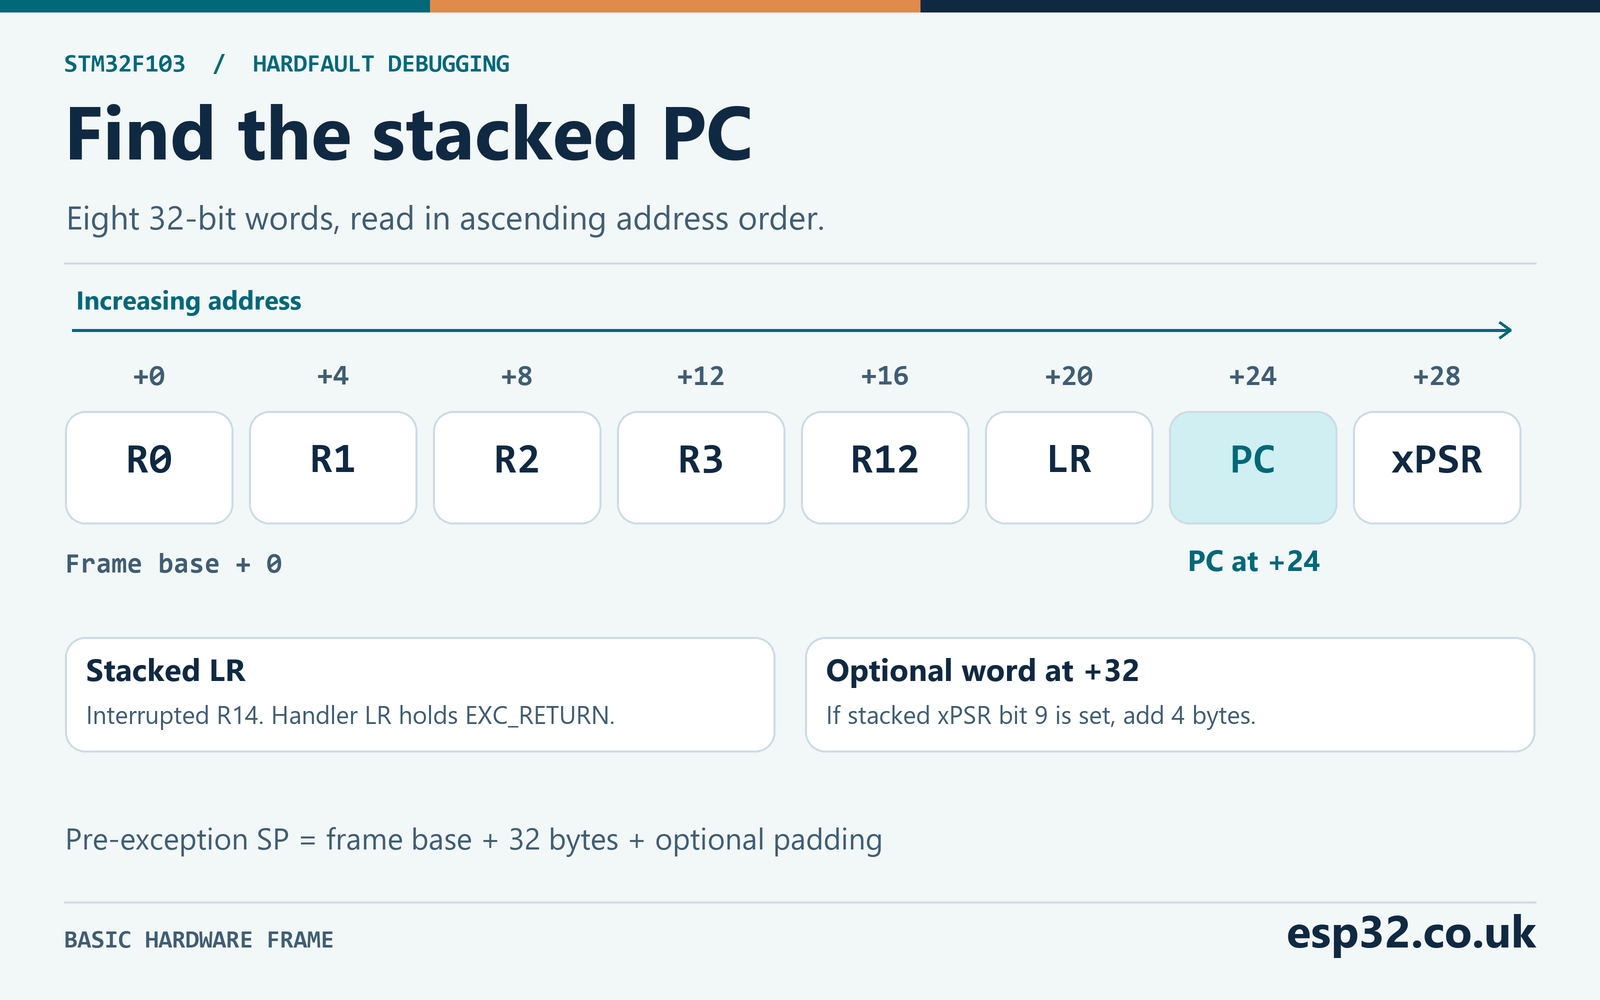
On Cortex-M3, the basic hardware frame contains eight 32-bit words. Read from the lowest address, they are R0, R1, R2, R3, R12, LR, PC and xPSR. The stacked LR belongs to the interrupted context. The LR that the handler receives at entry is EXC_RETURN. It encodes the return context and is separate from the saved application register. Capturing both is important when a fault occurs during another handler or in a thread that uses PSP.
| Offset from frame base | Saved word |
|---|---|
| 0, 4, 8, 12 | R0, R1, R2, R3 |
| 16 | R12 |
| 20 | Interrupted LR |
| 24 | Interrupted PC |
| 28 | xPSR |
For this core, EXC_RETURN 0xFFFFFFF1 denotes Handler mode and MSP. 0xFFFFFFF9 denotes Thread mode and MSP. 0xFFFFFFFD denotes Thread mode and PSP. The handler selects the candidate pointer with bit 2, then the C code validates the complete value. The handler itself executes on MSP. The interrupted context can have used either stack. The lab’s decoder covers basic Cortex-M3 frames. A port to a core with floating-point, security extensions or other frame forms needs the corresponding architecture rules.
Stack alignment padding leaves PC at byte offset 24 within the basic frame. Stacked xPSR bit 9 indicates an extra word used for alignment. If the frame starts at 0x20004FA0, the eight words occupy addresses up to 0x20004FBF. The address immediately above them is 0x20004FC0. Add four bytes to that address when the padding flag is set to reconstruct the stack pointer before the exception. Use that calculation only when the captured frame is credible.
The hardware frame contains a subset of the interrupted registers. R4 through R11 are outside this basic frame, and the supplied C recorder does not capture them. If a failing instruction uses R7 as a base pointer, you may need a live register view at exception entry or a recorder specifically extended to preserve those registers in assembly. The basic frame is often enough for a function argument or scratch register, but an omitted register must remain unknown in a report.
The saved LR can help locate a caller. A function may already have spilled its return address or reused LR by the time the fault occurred. In a handler, LR can also be an exception-return value. Use the disassembly and debug unwind data before treating a saved word as a call site. If you inspect raw stack memory, a value in the Flash address range may be a return address, a function pointer or an unrelated constant. Corroborate it with an actual call instruction and the layout of that function.
The xPSR also preserves execution context useful during triage. For a simple foreground test, the saved exception number in the IPSR portion should be zero. A nonzero number can identify an exception that was active before HardFault. Check the number against the Cortex-M exception and device interrupt mapping. That can narrow a failure during an ISR even if the saved PC is in a helper shared by several interrupts. Record the complete xPSR, including the Thumb state, instead of reconstructing it from a source-level call stack.
If you reconstruct the pre-exception stack pointer, distinguish the stack’s high address from its allocation size. In the 20 KiB SRAM example, the linker can set the initial MSP to 0x20005000, one byte beyond the bank, because the first push moves downward before writing. That address is a valid initial top in this layout but an invalid exception-frame base. The guard uses an exclusive upper boundary and requires the whole frame to fit. This distinction explains why a stack top displayed just above the last SRAM byte can be normal.
Set up the STM32F103C8 bench
Use a Blue PillAliExpress price with the STM32F103C8 and a working SWD programmer. The C8 has 64 KiB of Flash and 20 KiB of SRAM. This lab’s SRAM bounds are 0x20000000 through 0x20004FFF inclusive. Use the linker script for the actual device. Projects with a different device or a different stack allocation need corresponding bounds. The bench runs at the reset clock and has no external peripheral dependencies. ST STM32F103C8 datasheet · Blue Pill pinout
| Setting | Lab choice |
|---|---|
| Core and toolchain | Cortex-M3, GCC Thumb build |
| Debug transport | SWD |
| Vector entry | One strong HardFault_Handler in the final image |
| Trigger | Debugger sets fault_request in the foreground |
| Capture storage | Ordinary SRAM, inspected before reset |
| Deliberate fault | Thumb UDF with UsageFault disabled |
Create a normal CubeF1 project and keep Serial Wire debug enabled. Copy the two supplied files into the include and source folders. Cube projects commonly generate a HardFault_Handler in their interrupt file. Keep one strong definition by removing the generated handler body and function when installing the supplied implementation. Check again after regeneration. The linked vector table is the final authority on which handler will execute. An expected name in a source file is insufficient if another build configuration excludes that file. CubeMX and CubeIDE setup · ST GCC startup template
Connect SWDIO, SWCLK and ground, plus the probe’s target voltage reference as required. A reset connection is useful if you need connect-under-reset. For the intentional test, start normally, halt after initialization and set the request variable before resuming. Keep the ELF used to flash the device available to the debugger. A build regenerated from identical source can move instructions when compiler flags, libraries or link order change. Save the exact binary and its symbol file with any captured crash report. ST-Link wiring guide
If you use a release build, keep a separate copy of the ELF with debugging information. You can still distribute a stripped image. Check that the address map matches the code loaded on the board. Optimization can combine source lines, inline functions or move instructions, so a source location is an entry point for diagnosis. Look at the actual opcode and its operands. A fault at the first instruction of an inlined function may be reported against a line in its caller.
Save the original stack pointer before C
The naked assembly handler selects MSP or PSP from LR bit 2 and places the original frame pointer in R0. It copies EXC_RETURN to R1, then loads MSP with the top of an aligned 256-byte emergency stack. The branch to the C routine passes the two arguments through the usual ARM calling convention. The recorder never returns. Once MSP has changed, returning through this diagnostic path would require deliberate reconstruction of the original exception state, which is outside the lab’s purpose.
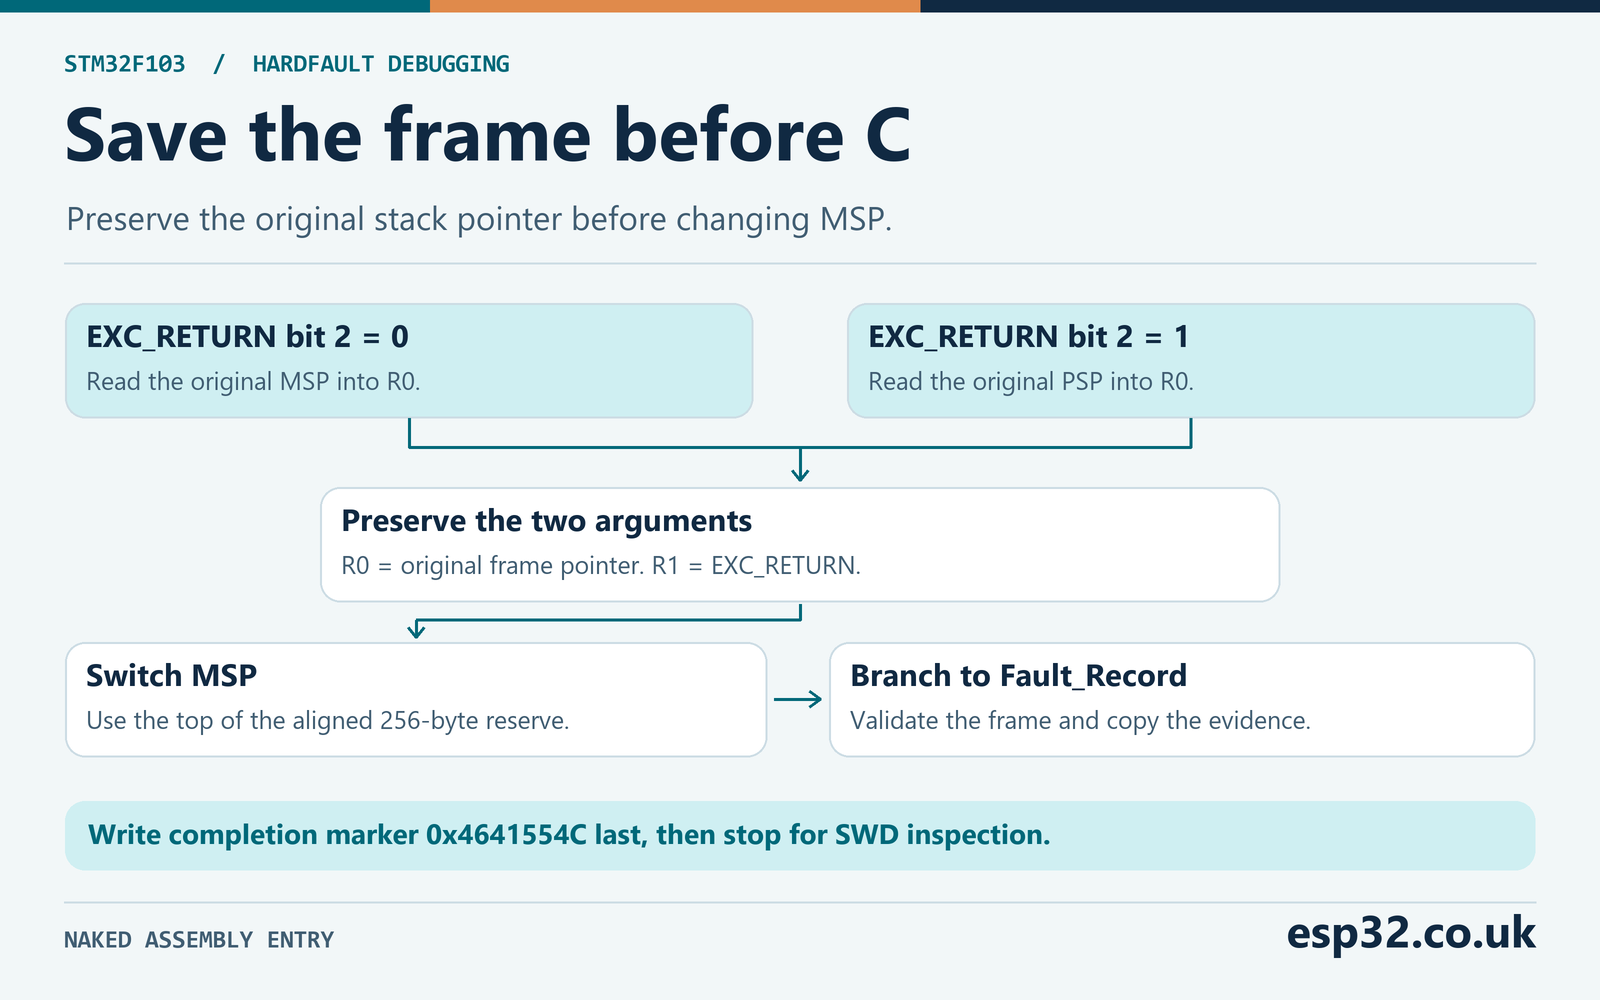
Order matters because a normal C prologue can push registers before the first source statement. If the interrupted frame used MSP, a pointer read after that prologue can point at the handler’s own data. The wrapper uses assembly only, so you can verify the pointer read before any stack access. Reading PSP selects the task’s frame in the corresponding case, while the emergency stack still supplies working space for the C recorder running in Handler mode.
The emergency stack reduces dependence on the application stack. It cannot repair a failure during hardware exception entry or guarantee a capture if SRAM or the vector table is damaged. Treat it as reserved diagnostic space and inspect its placement and size if you change compilers or add code. Avoid logging, memory allocation and application callbacks in this path. Those routines can require a working tick, an interrupt, a heap lock or a peripheral that was already involved in the crash.
The recorder accepts only the three basic EXC_RETURN values and a word-aligned address that leaves room for all 32 bytes. The highest accepted frame base is 0x20004FE0. Starting at 0x20004FF0 would leave only 16 bytes and fails the guard. It also refuses frames when CFSR indicates a stacking or unstacking fault. A passing guard means the diagnostic chose to copy the eight words. A damaged application stack can still contain plausible addresses and values inside the permitted SRAM range.
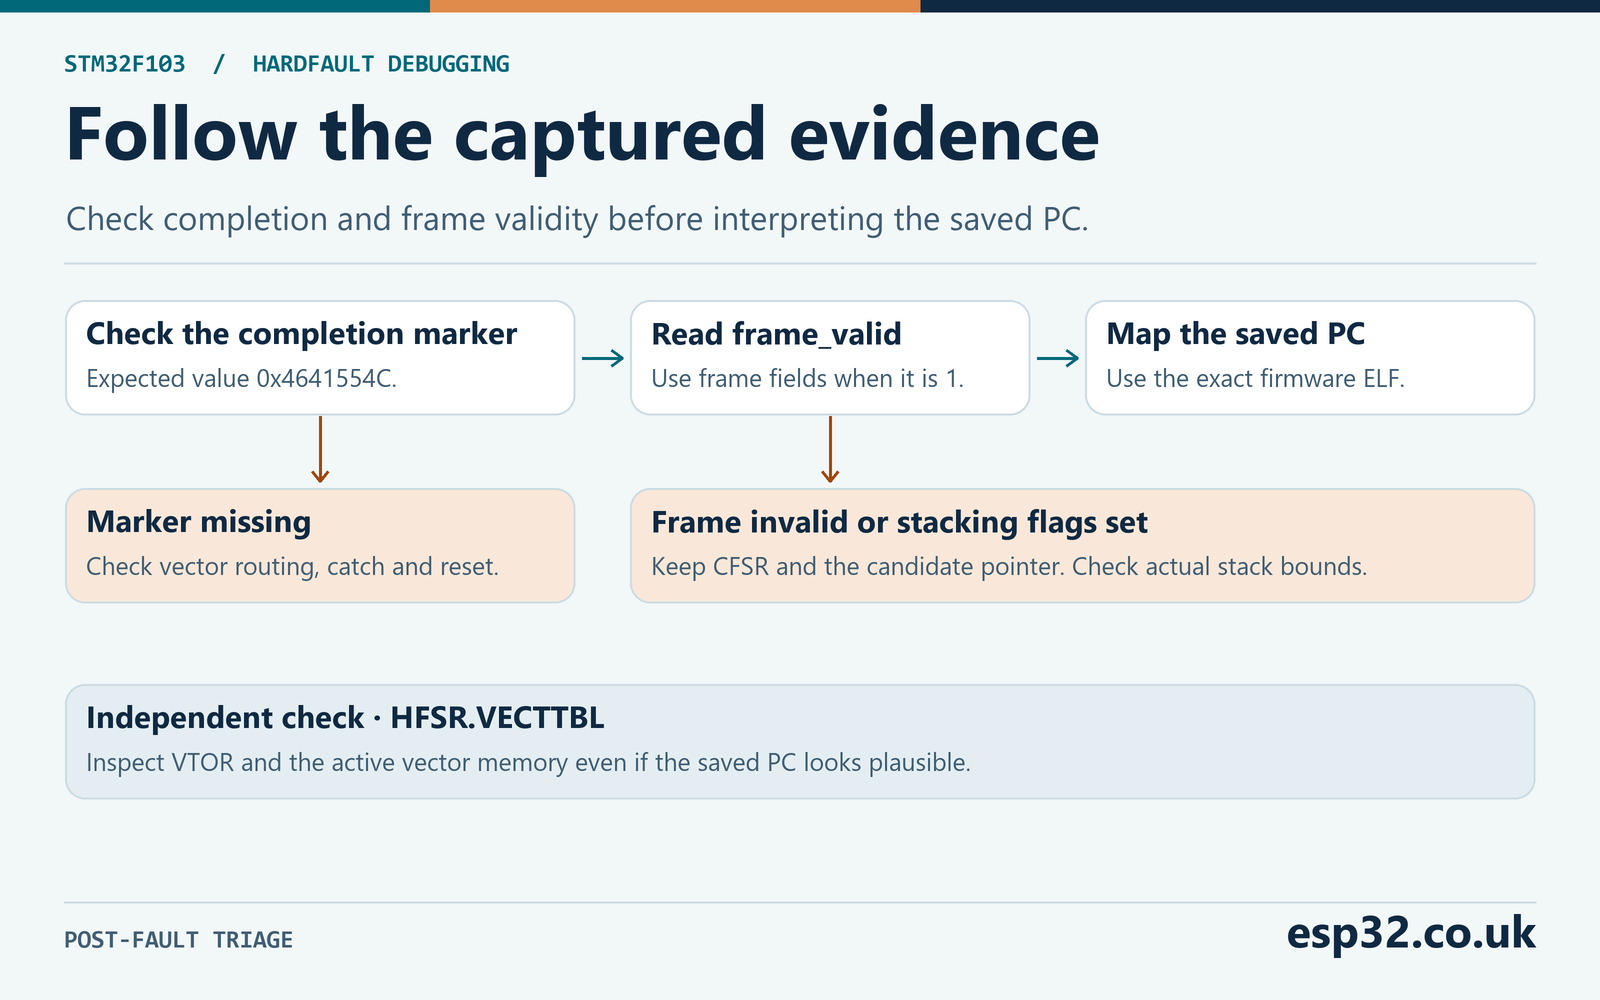
The completion marker is written after the other fields. A marker of 0x4641554C with frame_valid equal to one means the basic frame was copied. With the same marker and frame_valid equal to zero, use the captured status fields and the candidate pointer. Leave the frame fields out of your interpretation. A missing marker can indicate a breakpoint before capture finished, the wrong vector entry, a reset or a fault that prevented the handler from completing. The startup code clears this ordinary SRAM record on reset, so inspect it first.
The stack reserve is deliberately small. In the test build the recorder is a leaf routine, meaning it does not call another function. Verify that property if you alter the implementation. An added helper can change register allocation, stack usage and what happens when a peripheral is unavailable. Also account for an NMI that could still interrupt the HardFault context. A watchdog can reset the device while the final loop is waiting, so an actual watchdog-equipped deployment needs a capture policy suited to that reset. STM32 watchdog and reset evidence guide
#ifndef FAULT_LAB_H
#define FAULT_LAB_H
#include <stdint.h>

typedef struct {
    uint32_t magic, exc_return, frame_address;
    uint32_t cfsr, hfsr, shcsr, mmfar, bfar;
    uint32_t frame_valid;
    uint32_t r0, r1, r2, r3, r12, lr, pc, xpsr;
} FaultSnapshot;

extern volatile FaultSnapshot fault_snapshot;
void Fault_TriggerUndefined(void);
#endif
#include "fault_lab.h"
#include "stm32f1xx.h"
volatile FaultSnapshot fault_snapshot;
__attribute__((used, aligned(8))) static uint8_t fault_stack[256];
__attribute__((used, noreturn))
void Fault_Record(uint32_t frame, uint32_t exc_return)
{
const uint32_t sram_start = 0x20000000U;
const uint32_t sram_end = 0x20005000U;
uint32_t cfsr = SCB->CFSR;
fault_snapshot.magic = 0U;
fault_snapshot.exc_return = exc_return;
fault_snapshot.frame_address = frame;
fault_snapshot.cfsr = cfsr;
fault_snapshot.hfsr = SCB->HFSR;
fault_snapshot.shcsr = SCB->SHCSR;
fault_snapshot.mmfar = (cfsr & (1U << 7)) ? SCB->MMFAR : 0U;
fault_snapshot.bfar = (cfsr & (1U << 15)) ? SCB->BFAR : 0U;
fault_snapshot.frame_valid = 0U;
if ((exc_return == 0xfffffff1U || exc_return == 0xfffffff9U ||
exc_return == 0xfffffffdU) &&
!(cfsr & 0x1818U) && !(frame & 3U) &&
frame >= sram_start && frame <= sram_end - 32U) {
const volatile uint32_t *words = (const volatile uint32_t *)(uintptr_t)frame;
fault_snapshot.r0 = words[0];
fault_snapshot.r1 = words[1];
fault_snapshot.r2 = words[2];
fault_snapshot.r3 = words[3];
fault_snapshot.r12 = words[4];
fault_snapshot.lr = words[5];
fault_snapshot.pc = words[6];
fault_snapshot.xpsr = words[7];
fault_snapshot.frame_valid = 1U;
}
__DMB();
fault_snapshot.magic = 0x4641554cU;
__DSB();
for (;;) { __NOP(); }
}
__attribute__((naked, noreturn))
void HardFault_Handler(void)
{
__asm volatile (
"tst lr, #4\n"
"ite eq\n"
"mrseq r0, msp\n"
"mrsne r0, psp\n"
"mov r1, lr\n"
"ldr r2, =fault_stack\n"
"add.w r2, r2, #256\n"
"msr msp, r2\n"
"b Fault_Record\n"
);
}
void Fault_TriggerUndefined(void)
{
SCB->SHCSR &= ~SCB_SHCSR_USGFAULTENA_Msk;
__DSB();
__ISB();
__asm volatile (".inst.n 0xde00" ::: "memory"); /* Thumb UDF #0 */
}Declare the request flag in the generated user section and place the check in the foreground loop. The code should execute the deliberate fault only when you request the test.
#include "fault_lab.h"
volatile uint32_t fault_request;

/* Inside the generated foreground loop. */
if (fault_request) {
    fault_request = 0;
    Fault_TriggerUndefined();
}
Check the final binary for three details before running. The vector word should point to the linked handler in Thumb state. The first instructions in that handler should test LR, choose MSP or PSP, and move the chosen pointer before changing MSP. Finally, the C recorder should use the intended emergency stack region from the map. In the linked fixture the 256-byte array is aligned to eight bytes. Confirm that the initial application stack and emergency stack occupy distinct space in your map, with room for the application’s other RAM objects and worst-case downward growth.
In a typical GDB-backed session, the memory window can show the original words as a block. After the recorder is complete, use the saved frame address and inspect eight words only when frame_valid is set. Compare the seventh word with the decoded PC. If the executable was linked with debug information, also look up the symbol by address. This gives you two cross-checks before following a source line. In a production build with a custom linker layout, make the frame and reserved stack bounds part of that layout instead of silently inheriting the fixed lab values.
Trigger and decode a known fault
The trigger clears the UsageFault enable in SHCSR and uses the barriers shown in the listing before executing the undefined instruction. The GNU assembler directive emits the 16-bit Thumb halfword 0xDE00. The instruction raises an undefined-instruction fault. With the configurable UsageFault handler disabled in this foreground test, the expected result is escalation to HardFault. This gives you a reproducible exercise without depending on an arbitrary unmapped address or a peripheral clock fault.
Set fault_request to one over SWD and resume. If the debugger catches the exception at entry, resume again to let the recorder finish. Halt after it reaches the loop and inspect fault_snapshot. In a clean foreground run on MSP, expect EXC_RETURN 0xFFFFFFF9. Expect the UNDEFINSTR mask 0x00010000 in CFSR and the FORCED mask 0x40000000 in HFSR. Check for these bits without discarding other set bits. The documented values are predictions for the physical test, while the linked instructions and vector entry have been checked offline.
| Item | Expected in the deliberate MSP test |
|---|---|
| Completion marker | 0x4641554C |
| Frame flag | 1 |
| EXC_RETURN | 0xFFFFFFF9 |
| CFSR cause | UNDEFINSTR, bit 16 |
| HFSR cause | FORCED, bit 30 |
| Stacked PC | Address of the undefined Thumb halfword |
Locate the saved address in the disassembly. In the linked fixture, the undefined halfword is at 0x080001DA. A different build can place it elsewhere. An address lookup command is arm-none-eabi-addr2line with the -e option followed by the exact ELF and your saved PC. Add -f for the function and -C for demangling if needed. An objdump listing with -d and -S shows linked instructions and source when debug information is present. You can also open the disassembly view in CubeIDE and navigate to the captured address.
Inspect the vector if you land in a default handler. Read VTOR and examine the fourth word of the active table, at offset 12, which is the HardFault entry. Its low bit marks a Thumb entry address. Compare the remaining address bits with the linked HardFault_Handler symbol. If you see the address of the default handler instead, check the startup file, build inputs and active vector base. If the device reboots during the test, inspect reset evidence and verify that vector catch is configured as expected. ST debug toolbox AN4989
When inspecting the completion marker, avoid treating a debugger display refreshed during execution as a coherent snapshot. Stop once the handler has completed. Read the raw words and copy them to a note or crash report. For the deliberate test, compare the stack address against the SRAM range and inspect the saved xPSR. A readout from the middle of the recorder may have a mixture of current and previous values. The marker is a cheap way to tell whether the writer reached the end.
For a second run, reset the board, clear any debugger watch modifications and repeat the trigger. The status masks and the saved instruction should agree even if other peripheral state changed. If the second run produces a different fault, stop and record it as a separate result. A stale build, a debugger write to the wrong variable, or a change in processor context can produce a valid record for an entirely different event. Repeatability matters more here than the exact number of instructions between resuming and halting.
If the completion marker never appears, distinguish a hardware reset from a core that stopped making progress. With a reset you may see startup execute again, the request clear and SRAM reinitialized. A fault during exception entry or a second fault during HardFault can instead leave the core in lockup. Inspect debugger status and reset evidence before concluding that the recorder’s C code is broken. The emergency stack is selected by the handler’s instructions. It cannot take effect if the processor never reaches them.
Decode CFSR, HFSR and fault addresses
CFSR combines the MemManage status byte, the BusFault status byte and the UsageFault status halfword. The lowest eight bits correspond to MemManage, the next eight to BusFault and the upper sixteen to UsageFault. Keep the raw hexadecimal value in a report, since several bits can be set together. Decode it alongside HFSR. An escalation flag establishes the route to HardFault and the configurable fault bits supply the more specific evidence.
| CFSR indication | First check |
|---|---|
| IACCVIOL or DACCVIOL | Execution permissions, access permissions and target address |
| PRECISERR | Stacked PC and BFAR when BFARVALID is set |
| IMPRECISERR | Earlier stores, bus activity and asynchronous writes |
| UNDEFINSTR | Opcode at the saved PC and how execution reached it |
| INVSTATE or INVPC | Branch target state or exception return |
| STKERR, UNSTKERR, MSTKERR or MUNSTKERR | Frame credibility, task bounds and prior stack context |
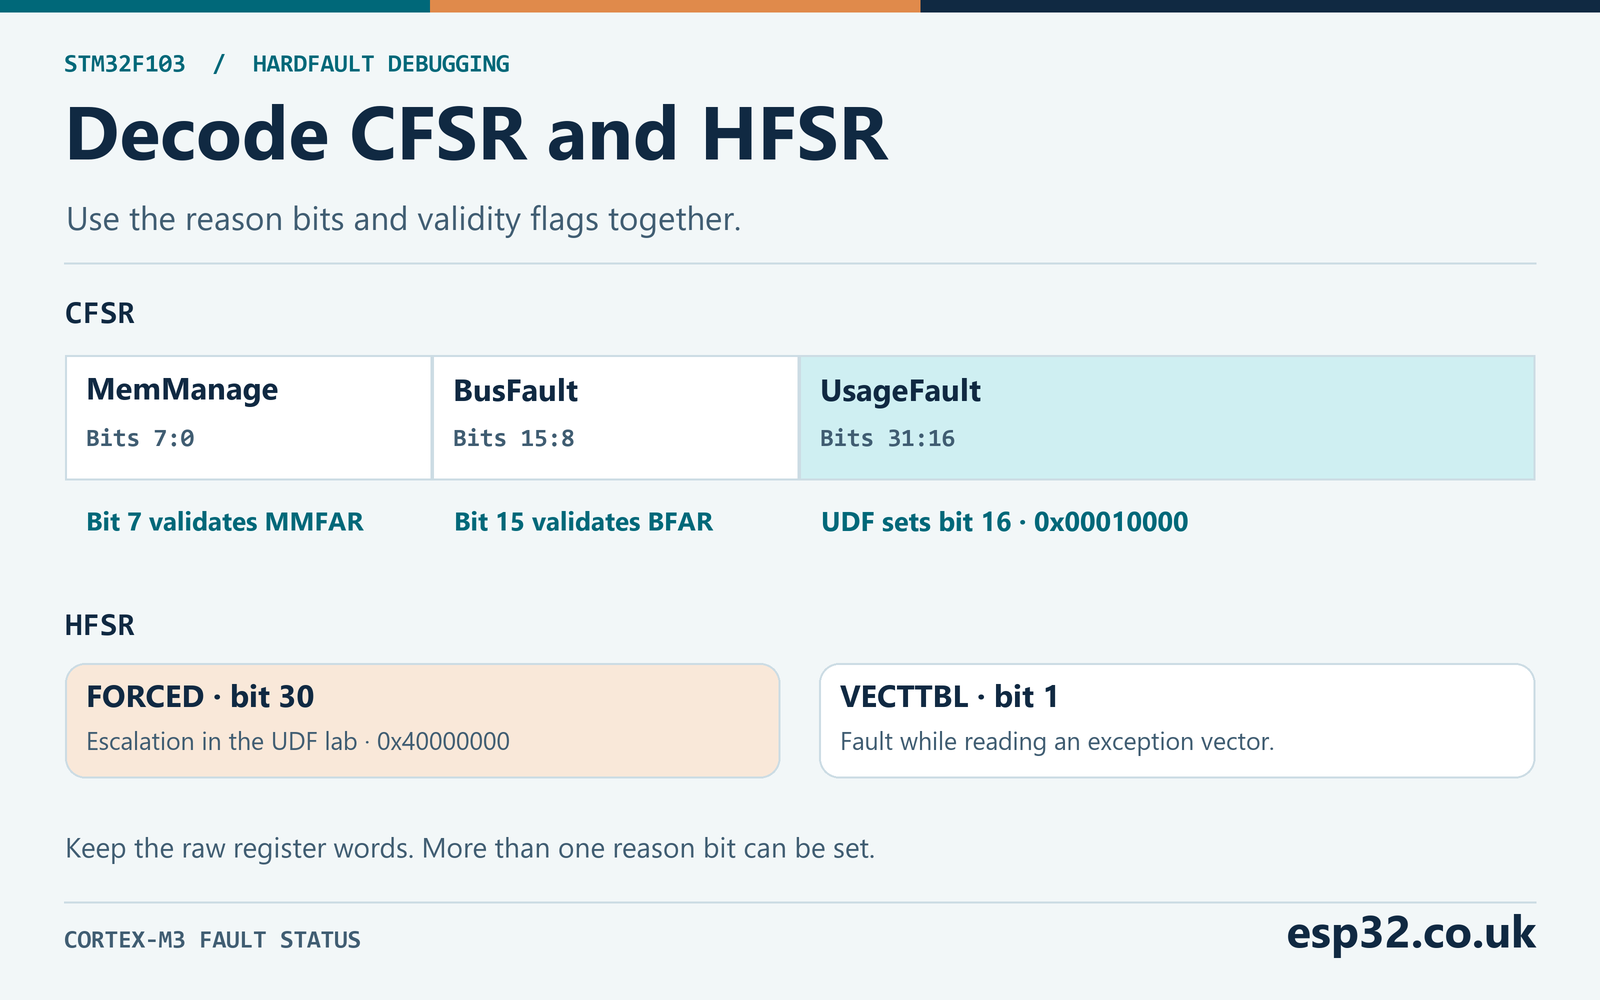
BFAR and MMFAR are meaningful when their corresponding validity bits are set. The recorder copies BFAR only when CFSR bit 15 is one, and MMFAR only when bit 7 is one. A zero in an invalid field is a placeholder. An address of zero in a valid field can be genuine. The fault address is the location of an access, whereas the saved PC is an execution address. Comparing them means interpreting the instruction and register values rather than looking for equality.
For a worked example, CFSR 0x00008200 contains PRECISERR at bit 9 and BFARVALID at bit 15. If the saved PC resolves to a load from [r0, #4] and R0 is 0x20005000, the effective address is 0x20005004. That is beyond the C8’s stated SRAM range. Compare it with the recorded BFAR, then investigate who assigned R0 and what object the access expected. This calculation illustrates how to use a precise fault record. The deliberate UDF lab does not generate this bus fault example.
For an imprecise BusFault, a write can be reported after the initiating instruction has retired. The stacked PC can therefore point later in the program. Review earlier writes and their destinations, including accesses to peripherals whose configuration might have changed. If you add a diagnostic barrier to a reproduction, record the location and build. That experiment changes timing and can help localize a pending write, while the original crash record remains evidence from a different binary.
When the saved opcode appears valid, revisit the flags. INVSTATE and INVPC point to processor state or exception return problems. A corrupt function pointer or return address can route execution through valid opcodes at the wrong location. A stacking fault can make the candidate frame suspect even if its PC happens to look reasonable. Treat a plausible address as one clue. Establish that the frame came from the expected stack, that the ELF matches and that the instruction agrees with the recorded reason.
For an additional decoding exercise, consider CFSR 0x00010010. It contains UNDEFINSTR and the MemManage stacking-error bit. The recorder should reject the frame because its stacking-error mask intersects the value, even if the candidate address is in SRAM. You can still use the two reason bits to direct the investigation. Conversely, a precise fault with no stacking flags and a valid frame permits instruction-level reconstruction. The guard’s decision and the cause of the fault are separate fields for this reason.
The same distinction applies to HFSR.VECTTBL. Begin with the active vector base and the memory mapping. A recorded fault address may be unavailable, and a plausible interrupted PC may only identify which code was running when the core tried to fetch a vector. Inspect which interrupt was enabled and whether its vector table was reachable. If the table was relocated into SRAM, check that initialization finished before interrupts were enabled and that the reserved table memory was not reused by another component.
Diagnose bad stacks and bad handoffs
Start with the linker map or the RTOS task’s stack allocation. The chip-wide SRAM test in this lab can reject a pointer outside the memory bank. A task’s stack can overflow into another object inside the same bank and still pass. Compare the saved pointer with that task’s actual lower and upper limits. Inspect high-water measurements under the real workload, including error paths and interrupt nesting. A test of the idle loop says little about the peak stack demand in a long call chain.
On an RTOS, identify which task owned PSP at the time of the exception. The handler runs on MSP, which must also be valid for normal exception entry. Those are separate budgets. If the RTOS supplies its own handler, integrate the capture at its existing entry point and preserve the register contract that port expects. Installing a competing handler or using this lab’s permanent loop changes system recovery behavior. Verify both the debugger exercise and the real recovery path after integrating.
| Observation | Follow-up |
|---|---|
| Valid frame and a precise load fault | Decode instruction operands and pointer ownership |
| Candidate outside SRAM or stacking error | Check the stack allocation and exception entry |
| EXC_RETURN selects PSP | Identify the interrupted task and its stack bounds |
| HFSR.VECTTBL | Check VTOR and active vector memory |
| Completion marker absent | Check handler routing, debugger catch and possible reset |
| PC resolves to unrelated code | Verify the exact ELF and consider an imprecise fault |
For a failure immediately after a bootloader jump, read VTOR and compare the live vector table with the application’s linked layout. Check the initial stack pointer, the reset entry and whether the application was linked for the same Flash address where it was programmed. A fault early in the handoff may still use the bootloader’s handler. That can explain a missing application snapshot even when the application contains a valid fault recorder. Preserve the two ELF files and label which one owned each address range. STM32 bootloader application handoff guide
For a bad pointer, work backward from the instruction to the origin of the address. If the address came from a buffer index, verify the bounds and element size. If it came from a struct member, check object lifetime and initialization. If it was produced by an interrupt or DMA callback, check concurrent updates and publication order. Fix the cause at the point where the pointer is created or invalidated. Reproduce the original failure condition and confirm the changed code no longer reaches the bad access.
One way to narrow a suspected stack overflow is to change only the stack allocation, then repeat the same trigger and compare the captured addresses. A fault that moves or disappears when stack space increases points toward that resource, but inspect the linker map because changing a stack can move other objects too. A stronger check measures stack use across the workload and verifies that the new allocation includes interrupt overhead. Keep the test case, optimization and clock settings the same when comparing the two runs.
Preserve evidence when a device resets
This lab leaves the record in ordinary SRAM for immediate inspection. A production device may need to restart. A reserved SRAM section can survive some warm resets when the startup code and the reset domain preserve it. It cannot retain data across power loss. Test a clean boot, a reset after a completed capture and a reset partway through a capture. Record a version and a build identifier if the reader may be updated independently of the writer. Check that the startup code leaves the reserved region untouched.
If durable storage is required, prefer transferring the validated record from a healthy startup or supervisor. Flash programming inside a compromised fault context can depend on clocks, locks and memory that may no longer be trustworthy. Decide how to handle an incomplete record and how many consecutive crashes should be retained. Preserve reset flags early enough that later initialization cannot clear them before you read them. A watchdog reset and the crash record together provide a better timeline than either one alone.
When reporting a fault, include the MCU, clock and build, the triggering activity, EXC_RETURN, frame validity and raw reason registers. Add the address lookup result and the instruction bytes. For a real incident, keep the original evidence and the reproduction separately identified. After a fix, repeat the original trigger with the same workload and document which observation changed. This turns a screenshot of a HardFault handler into a test of a specific failure mechanism.
Use a small fault worksheet
| Field | Example from the intended UDF exercise |
|---|---|
| Trigger | Set the foreground request over SWD |
| Capture state | Completion marker present, frame copied |
| Context | Thread mode using MSP |
| Reason | Undefined instruction escalated to HardFault |
| Address lookup | Saved PC resolves to Thumb halfword 0xDE00 |
| Next test | Reset and repeat with the same ELF |
For an unknown crash, replace the expected values with what you actually observed. Write down whether the frame was copied and which fault address registers were valid. If a field is unavailable, leave it explicitly unknown. That makes it possible for a colleague to distinguish an address the processor captured from one inferred from disassembly. Include the stack’s configured range when the failure involves exception entry, and the vector base when the firmware recently jumped between images.
When the underlying bug appears fixed, repeat the intentional UDF as a separate diagnostic check before removing the lab trigger from the production build. An unchanged fault capture for the known trigger establishes that the recorder still works after the application changes. A successful run of the former failure scenario establishes something different about the application. Keep both results with the build information. If you retain only one artefact for later symbolization, keep the actual linked ELF from that build.
For a register capture forwarded to another team, include the hexadecimal words in plain text as well as any screenshot. Text values can be fed into an address lookup or compared across reports without reading an image. Note the debugger’s reported architecture and the mapping of code and SRAM. If the report came from a production device that reset, include the reset reason and whether the record passed the completion and version checks. A missing capture can be a useful symptom once the expected persistence behavior is documented.