Quick Summary (TL;DR)
A five-year ownership comparison is not the same as a five-year payback claim. Solar panels can keep generating for decades, while batteries, inverters, metering equipment and backup components have different service lives, warranties and replacement risks. A fair five-year model starts with a common household and energy tariff, measures what each system changes, then adds the upfront purchase, professional installation, maintenance allowance, monitoring costs and any genuine export revenue.
Our recommendation: obtain an itemised installed quote for a solar-only system before pricing the battery upgrade. Compare that upgrade against the extra savings it produces, not the total savings produced by solar and battery together. Choose a larger battery or backup output because it meets a measured load or resilience requirement, not because it must automatically produce more financial savings. Always test tariffs, solar yield and export prices independently.
For the transparent worked example below, a 5 kWp solar installation, a 5 kWp solar-plus-5 kWh battery package and an enhanced 10 kWh battery system with essential-load backup have illustrative five-year ownership costs of approximately £10,267, £14,051 and £18,610, respectively. These are model outputs using explicitly invented cost assumptions—not supplier quotes or promises. Each option reduces electricity bills relative to a £1,200-per-year no-solar baseline, but no option repays its entire installation cost within five years under these assumptions.
What should five-year ownership cost include?
A quote labelled “£7,000 for solar” is incomplete unless you know what is included. Two systems with the same rated panel power may differ in inverter technology, scaffolding, AC protection, isolators, generation and export meters, commissioning, certification, roof access and warranties. A cheap quote that omits necessary work is not automatically cheaper to own. Similarly, a lithium battery price alone says little about the finished installation: compatible inverter/charger, battery management, DC and AC protection, cabling, mounting, communications, commissioning and backup changeover may be separate charges.
Our five-year model deliberately separates five ledgers. Capital expenditure is the cash paid to get the system commissioned. Net electricity spending is purchased energy minus payment for exported solar energy, using tariffs that are clearly stated. Operating allowance budgets for monitoring subscriptions, inspections and modest service work without pretending that cleaning or visits always occur annually. Unplanned repairs are assessed as risks, not falsely represented as guaranteed invoices. Resale and residual value are not assumed to be cash recoverable in year five.
| Cost category | Solar only | Solar plus battery | Larger battery with backup | How to verify |
|---|---|---|---|---|
| Panels, mounting and roof work | Essential | Essential | Essential | Full bill of materials and roof design |
| Grid-compliant inverter and protection | Essential | Hybrid or battery-compatible architecture | Backup-capable architecture plus suitable protection | Exact inverter model and approved diagrams |
| Battery, BMS and cabling | None | Required | Required, often more capacity | Usable kWh, discharge power and compatibility list |
| Meter/CT and monitoring | Often built in; check | Usually essential for battery control | Often more complex | Separate monitoring and control interfaces |
| Backup output and changeover | Not assumed | Not assumed | Specifically budgeted | Essential-load circuit schedule and installer sign-off |
| Service, software and metering | Budget a modest allowance | Add possible battery/gateway support | Include additional backup testing | Written support and firmware policy |
| Electricity import minus export receipts | Depends on use and tariffs | Includes battery efficiency losses | Includes backup reserve impact | Half-hourly import/export data where available |
Why five years is useful but limited
Five years is long enough to expose the cost of a tariff change, an inverter monitoring subscription or a modest maintenance event, but far shorter than a normal solar-panel design life. Energy Saving Trust states that solar panels can last 25 years or more and that a solar inverter may require replacement around 12 years. It also cites a typical domestic battery life of about 10–12 years, although actual life and retained capacity depend on the design and use. Those are broad guidance ranges, not automatic warranty promises for a particular product. Compare the written warranty for the panels, inverter, battery cells, throughput, labour and installation separately. See the source links at the end.
Three comparison systems and their equipment baskets
To make the maths auditable, all three systems are assigned exactly the same house, roof and baseline energy demand. They are examples for a British household rather than live prices in the UK market; ask installers for current itemised quotes and check regional taxes, approvals and grid-connection rules. All costs here are GBP including illustrative installation allowances, but do not imply that any real seller offers this complete basket for the number shown.
Scenario A: 5 kWp solar only. A grid-tied rooftop PV system feeds household loads, exporting excess power. There is no battery and no dedicated power-cut supply. Home Assistant can still monitor inverter output and a compatible grid meter, but the automation layer does not have to control electrical protection. The example installed price is £7,000.
Scenario B: 5 kWp solar plus a nominal 5 kWh battery. The same solar array and roof receive a compatible battery, associated protection, cabling and commissioning. A battery may shift surplus generation into evening loads, but usable capacity, discharge limits and round-trip losses mean that the delivered kWh is lower than the kWh charged. The example installed price is £11,500.
Scenario C: 5 kWp solar plus nominal 10 kWh storage and essential-load backup. The larger battery package includes suitably designed backup/changeover equipment and a small backed-up distribution arrangement; it does not promise to run an entire house, high-current heat pump or EV charger during an outage. A qualified electrician specifies neutral and earthing arrangements, load selection, RCD protection and safe disconnection for the actual equipment and premises. The example installed price is £16,000.
| Illustrative installed-cost line | A: 5 kWp PV | B: PV + 5 kWh | C: PV + 10 kWh / backup |
|---|---|---|---|
| Solar modules and mounting materials | £3,400 | £3,400 | £3,400 |
| Inverter, DC/AC protection and switching | £1,450 | £1,450 | £1,450 |
| Scaffolding, labour and commissioning | £1,800 | £1,800 | £1,800 |
| Metering / monitoring provision | £350 | £350 | £350 |
| Battery modules | £0 | £2,750 | £5,100 |
| Battery protections and interface hardware | £0 | £900 | £1,100 |
| Additional battery commissioning | £0 | £850 | £0 (included in backup work below) |
| Essential-load backup, transfer and commissioning | £0 | £0 | £2,350 |
| Additional gateway / backup monitoring | £0 | £0 | £450 |
| Total installed, illustrative | £7,000 | £11,500 | £16,000 |
The cost baskets are deliberately simplified. They do not include roof repairs, planning exceptions, distribution-network upgrades, significant cable runs, structural reinforcement, unusual earthing work, remedial consumer-unit replacement, financing or battery replacement. If a quote includes such work, add it as an explicitly documented line, not a hidden “contingency”. If your existing solar inverter supports no approved battery connection, a retrofit may cost more than a combined new-build installation.
The shared household and tariff assumptions
A comparison only works when it holds the household constant. Suppose a household uses 4,800 kWh/year and a site-specific yield calculation estimates that a 5 kWp array produces 4,500 kWh in the first year. That represents 900 kWh per kWp annually and is a modelling assumption, not a universal UK production figure. Check your own orientation, pitch, shading, weather and losses with the NREL PVWatts calculator or an installer model and, preferably, actual consumption records.
For the simplified first-year tariff, assume grid electricity imports cost 25 pence/kWh and exported energy earns 8 pence/kWh. Standing charges are omitted because they are identical across the three scenarios; they still appear on the real bill. Any time-of-use tariff or export scheme with conditions needs a time-resolved model, not a single blended price. Ofgem explains that Smart Export Guarantee (SEG) rates and contract terms vary by supplier, so the 8p figure is not a current market quotation or guaranteed rate.
| Input | Assumption | What to replace with your own figure |
|---|---|---|
| Household consumption | 4,800 kWh/year | Actual annual utility import and self-consumed generation |
| Year-one PV production | 4,500 kWh | Roof-specific expected AC generation or measured output |
| Direct PV self-consumption | 1,575 kWh (35% of generation) | Interval-based load/solar overlap |
| Small battery solar charging | 1,400 kWh/year | Site-specific surplus actually available for charging |
| Large battery solar charging | 1,700 kWh/year | Same; do not assume full cycles every day |
| Battery round-trip delivery | 85% of charged energy | Measured AC-AC or clearly defined DC/AC boundary |
| Import price | £0.25/kWh | Supply tariff relevant to avoided peak consumption |
| Export receipt | £0.08/kWh | Signed SEG/export agreement and eligibility |
| PV ageing | 0.5% annual reduction (illustrative) | Panel guarantee and engineering assumptions |
| Battery shifted throughput ageing | 1.5% annually (illustrative) | Battery capacity, throughput and behaviour model |
| Annual service/monitoring allowance | A £75 / B £110 / C £160 | Actual support, planned inspections and subscriptions |
This example assumes batteries only charge from surplus solar, never from off-peak grid power. It also assumes sufficient evening load exists to use the discharged energy, no power export from a battery, no curtailment, and that the same solar generation profile is available in all three scenarios. Those simplifications are deliberate so that the incremental benefit is visible. They are not an operational guarantee.
The energy accounting: avoid double counting
Start with the no-solar home. At 4,800 kWh and 25p/kWh, annual variable electricity spend would be £1,200. Next, allow the 5 kWp solar array to generate 4,500 kWh. With 1,575 kWh consumed directly in the house, the other 2,925 kWh is exported. The grid must still deliver 4,800 − 1,575 = 3,225 kWh. Therefore annual net variable electricity cost is 3,225 × £0.25 − 2,925 × £0.08 = £572.25. The solar-only system’s year-one variable bill reduction is £627.75 before service costs.
Now add the small battery. It captures 1,400 kWh that would otherwise have been exported, returning 1,190 kWh to useful household loads after 15% round-trip loss. Home consumption from solar rises to 1,575 + 1,190 = 2,765 kWh. Remaining imports are 4,800 − 2,765 = 2,035 kWh. Exports fall from 2,925 to 1,525 kWh. The new net variable bill is 2,035 × £0.25 − 1,525 × £0.08 = £386.75.
The battery alone improves the bill by £572.25 − £386.75 = £185.50 per year in this particular example. You can calculate the same result as 1,190 × 25p − 1,400 × 8p = £185.50. Crediting the battery for all £813.25 saved versus the original non-solar home would overstate its value because most of that saving came from the panels.
For the large battery, assume it shifts 1,700 kWh of otherwise-exported solar per year and returns 1,445 kWh at 85% efficiency. Imports become 1,780 kWh, exports 1,225 kWh and the net variable bill £347.00. The extra battery capacity reduces the bill just £39.75 beyond the smaller battery in year one, even before its greater capital and service cost. Additional capacity may still be valued for sustained essential-load backup or future electrification, but those are distinct purchasing objectives.
| Year-one energy-flow comparison | No solar | A: PV only | B: PV + 5 kWh | C: PV + 10 kWh |
|---|---|---|---|---|
| Household demand (kWh) | 4,800 | 4,800 | 4,800 | 4,800 |
| PV production (kWh) | 0 | 4,500 | 4,500 | 4,500 |
| Direct PV consumption (kWh) | 0 | 1,575 | 1,575 | 1,575 |
| Solar sent into battery (kWh) | 0 | 0 | 1,400 | 1,700 |
| Battery delivered to home (kWh) | 0 | 0 | 1,190 | 1,445 |
| Electricity imported (kWh) | 4,800 | 3,225 | 2,035 | 1,780 |
| PV electricity exported (kWh) | 0 | 2,925 | 1,525 | 1,225 |
| Net variable energy bill | £1,200.00 | £572.25 | £386.75 | £347.00 |
| Bill benefit versus no solar | £0.00 | £627.75 | £813.25 | £853.00 |
Critical accounting rule: battery discharge is not new generation. If Home Assistant shows panel generation, battery discharge and home load as separate sources, never simply add all three and call the result “solar produced”. Use the actual measurement boundaries, split grid imports from exports and ensure that energy counters are monotonically increasing, with the right device class and state class for the Energy dashboard. Our existing Home Assistant energy troubleshooting guide is a useful companion.
Five-year cash flow: the three ownership totals
In this model, PV output falls by an illustrative 0.5% each year. Directly self-consumed PV falls proportionally. Battery charging also falls with solar yield and a separate 1.5% annual throughput factor, reflecting a modest loss of usable cycling opportunity. Battery round-trip efficiency is held fixed at 85% for simplicity; real performance varies with operating power, temperature, standby consumption, usable state-of-charge limits and inverter path.
For each year, variable bill = imported kWh × import price − exported kWh × export price. The ownership total equals the installed price plus five years of variable bills plus the scenario’s annual servicing budget. There is no debt interest, inflation or discount factor in this comparison, and no sale of residual equipment at year five. That makes it a transparent nominal cash-outlay illustration, not an investment appraisal.
| Operating year | A: PV variable bill | B: PV + 5 kWh bill | C: PV + 10 kWh bill | No solar bill |
|---|---|---|---|---|
| Year 1 | £572.25 | £386.75 | £347.00 | £1,200.00 |
| Year 2 | £575.39 | £393.58 | £354.63 | £1,200.00 |
| Year 3 | £578.51 | £400.33 | £362.15 | £1,200.00 |
| Year 4 | £581.62 | £406.99 | £369.57 | £1,200.00 |
| Year 5 | £584.71 | £413.56 | £376.88 | £1,200.00 |
| Five-year variable bills | £2,892.48 | £2,001.21 | £1,810.23 | £6,000.00 |
| Five-year ownership line | A: 5 kWp PV | B: PV + 5 kWh | C: PV + 10 kWh + backup |
|---|---|---|---|
| Installed capital | £7,000.00 | £11,500.00 | £16,000.00 |
| Five years of net variable electricity bills | £2,892.48 | £2,001.21 | £1,810.23 |
| Five years service/monitoring allowance | £375.00 | £550.00 | £800.00 |
| Five-year total cash outlay | £10,267.48 | £14,051.21 | £18,610.23 |
| No-solar five-year variable-bill benchmark | £6,000.00 | £6,000.00 | £6,000.00 |
| Difference versus the benchmark (positive = extra spent) | £4,267.48 | £8,051.21 | £12,610.23 |
The five-year cash comparison does not mean solar is a bad long-term investment. The same array may operate for another two decades, while its capital cost is paid only once. It means the reader should avoid “pays for itself in five years” claims unless a site-specific, whole-life cash-flow model supports them. If you can finance an investment instead of paying cash, include interest and fees. For genuine investment appraisal, calculate discounted cash flows and residual equipment value, with the same approach for every scenario.
Which upgrade provides the best incremental value?
Scenario B costs £4,500 more to commission than A. It delivers £185.50 extra year-one net energy savings, while its yearly service allowance is £35 higher. The first-year incremental benefit after that allowance is therefore only £150.50. A simple £4,500 / £150.50 gives about 29.9 years of nominal incremental payback, before capacity degradation or replacement costs. A typical battery will not last that long; this is a warning that the example battery does not have a defensible financial payback at these tariffs and consumption patterns.
Scenario C costs £4,500 above B and reduces the first-year bill by a further £39.75. Its assumed annual maintenance allowance is another £50, so on this specific annualised model it actually costs more to run after maintenance. That does not make backup useless: many households assign value to keeping medical equipment, broadband, refrigeration, sump pumps or lighting powered through a real outage. But it is misleading to hide those resilience costs inside an energy-saving payback calculation.
Do not infer from the example that all batteries lose money. Energy Saving Trust’s July 2026 research found that the combination of clean energy equipment with an appropriate time-of-use tariff can change savings materially. A household with a high evening peak rate, cheap off-peak charging, low export remuneration and substantial night-time use may justify a different strategy. Model actual tariff periods, forecast loads and charge/discharge efficiency before committing.
The sensitivity tests that matter most
A solar installation does not produce the same financial result everywhere. Orientation, winter cloud cover, summer export limits, shade, household occupancy, EV charging, heat-pump demand and metering schemes can alter the energy flows. The two price variables also move independently: the import rate determines the value of self-consumption, while the export rate determines the opportunity cost of storing rather than selling solar. For the small battery, the incremental annual energy saving is 1,190 × import price − 1,400 × export price, using the example’s unchanged throughput.
| Import tariff | Export tariff | Small-battery gross saving versus PV alone | After £35 extra yearly allowance |
|---|---|---|---|
| 15p/kWh | 8p/kWh | £66.50 | £31.50 |
| 25p/kWh | 8p/kWh | £185.50 | £150.50 |
| 35p/kWh | 5p/kWh | £346.50 | £311.50 |
| 25p/kWh | 15p/kWh | £87.50 | £52.50 |
| 20p/kWh | 20p/kWh | −£42.00 | −£77.00 |
The negative result in the final row is mathematically legitimate: exporting 1,400 kWh at 20p could pay £280, while later buying 1,190 kWh at 20p would cost only £238. Under such assumptions, losing 15% through battery cycling makes storing that generation worse than exporting it. Tariff rules, deemed export, grid-charging restrictions, settlement periods and contract terms may also affect real outcomes. Never assume you may charge cheaply from the grid and later export at a premium unless your tariff and hardware rules permit it.
Lower solar yield and different household profiles
If the array produces less electricity than expected, both self-consumption and export revenue can fall. However, the financial response is not always proportional: a household with daytime occupancy may self-consume a higher percentage of a smaller yield, while a mostly empty house may export more. A larger battery also does not automatically capture extra solar in winter when there is little surplus to capture. Seasonal allocation matters more than the nominal battery nameplate.
For example, a heat-pump household using most of its energy in dark winter evenings cannot simply rely on annual summer PV totals to conclude that a 10 kWh battery will run the heat pump economically. An EV charger may increase daytime consumption and therefore reduce the surplus available to charge the battery. The same kWh cannot be counted simultaneously as EV charging, solar export and battery charging. Use 15- or 30-minute data from the actual home rather than multiplying annual generation by a guessed “self-consumption percentage”.
Inverter and battery replacement risk
A five-year model can carry an annual allowance without pretending that every inverter needs servicing each year. For longer-term decisions, build an alternative 12- or 15-year case that includes a possible inverter replacement and a plausible battery renewal or residual capacity at the product’s warranted age. Do not assume that an 80% capacity warranty guarantees 80% of day-one delivered usable AC energy under all conditions. Temperature, warranted throughput, cycling behaviour and warranty exclusions matter.
If monitoring requires a cloud subscription after the free introductory period, add that cost. If a manufacturer discontinues access to its data API, the financial cost might be a replacement gateway or loss of automation flexibility rather than a fault in the power-conversion hardware. That is one reason to prefer documented, supported local access where it is available.
Monitoring hardware: is an ESP32 or Home Assistant worth the extra spend?
Monitoring can improve diagnosis, but it is not inherently an energy-saving product. A clean Home Assistant dashboard makes grid imports, exports, battery charge, battery discharge and PV generation understandable. It can flag an inverter that stops producing, compare production against a solar forecast, and help find flexible loads. However, it cannot fix a poor hardware design, missing electrical protection, unsuitable tariff or undocumented battery communications link.
A sensible first layer is the inverter manufacturer’s supported monitoring gateway and an appropriate bidirectional grid meter. Only add separate CT equipment where it answers a question the existing system cannot answer. Before purchasing, see our ESP32 energy-monitoring methods comparison and the ESP32 Modbus energy-meter Home Assistant guide.
| Monitoring decision | Possible five-year budget line | When it helps | Caveat |
|---|---|---|---|
| Manufacturer inverter portal | £0 in model | Basic PV production and error alerts | Check future charges and cloud dependency |
| Proper utility/grid import-export meter | Included in example | Energy settlement and accurate flows | Billing meter and inverter-control meter may differ |
| Local Modbus/RS485 or gateway interface | Budget explicitly if additional | Offline visibility or richer device telemetry | Needs manufacturer support and safe wiring |
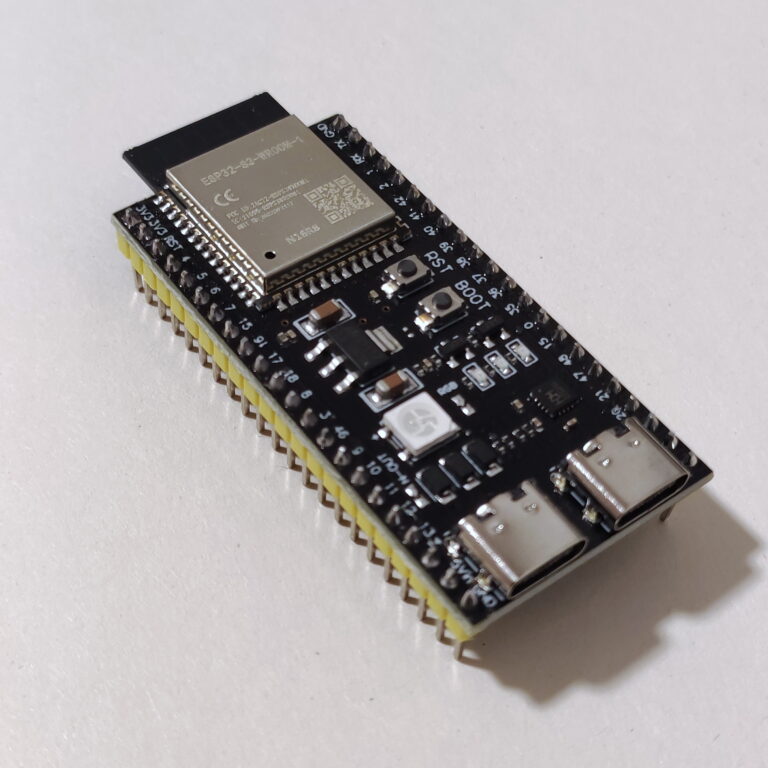
| Optional ESP32AliExpress price / ESPHome sensor | Project-specific; not assumed free | Low-voltage supplementary sensing | Must not intervene in safety-critical BMS control |
| Home Assistant host and storage | Incremental share of existing system cost | Energy views, trends and alerts | Include uptime, backups and software maintenance |
| Monitoring service subscription | £0 unless quoted | Remote history, notifications or support | Check renewal term and data portability |
Where Home Assistant already runs on a home server, counting the entire server purchase as a solar-only cost may be unfair. Conversely, if the server is being bought solely to run battery automation, pretending the cost is zero is also unfair. Allocate only the incremental cost attributable to the project and document the reasoning. Electricity consumed by 24/7 monitoring hardware can be small but should not be ignored in a tight battery arbitrage model.
Use the Home Assistant Energy dashboard’s correct entities and statistics. A grid-connection CT gives net power at the connection but does not automatically measure solar production, and a battery may have separate charge and discharge counters. Ensure a monitoring device does not confuse instantaneous watts with cumulative kWh, and validate dashboard totals against the utility bill before relying on apparent savings. For DIY supplementary sensing, our published ESP32 CT clamp guide explains the principles; work inside a consumer unit remains for a competent professional.
Backup power: pay for the capability you actually need
Backup functionality changes both equipment and commissioning requirements. Some batteries supply loads only while the grid is present. Others have an emergency-power output but need manual activation or a separate backup interface; others support automatic changeover. It matters whether the installation can start from battery when the grid is absent, whether solar charging continues during a prolonged outage, and which circuit will actually be energised. An app label saying “backup ready” cannot replace a single-line diagram and a successful commissioning test.
In our larger-battery scenario, £2,350 of the illustrative basket is assigned to backup changeover and essential-load work. That is a cost of resilience, not an assumption of saved electricity. If a customer places a personal value on avoided losses during outages, they can record it separately, but assigning an arbitrary £500/year “backup revenue” would manufacture an attractive ROI. Calculate essential-load kW, start-up surge, battery usable kWh and reserve state of charge; check the manufacturer’s documented duration, power limits and supported wiring arrangement.
Do not independently wire an inverter’s EPS output into the home’s normal circuits or defeat isolation arrangements. Grid connection, earthing, RCD operation, protective devices and anti-islanding behaviour require appropriate professional design, testing and approval under local rules. Home Assistant is an optional supervisory layer, not the safety system.
Seven questions to ask before accepting an installer quote
- What exactly is included? Ask for panel and inverter model numbers, battery kWh (usable versus nominal), mountings, scaffolding, isolators, certification, commissioning and disposal of packaging.
- What does the system generate at this roof? Request an annual and monthly yield forecast, shading and loss assumptions, and an explanation of why the prediction fits your roof rather than a generic regional example.
- How much output will the battery actually shift? Request charging and evening load profiles, round-trip efficiency at the defined measurement boundary, standby losses and the reserve percentage.
- What happens in a power cut? Ask which specific circuits remain energised, how changeover operates, whether PV can recharge the battery during an outage and what protection tests will be documented.
- Which warranty pays for what? Confirm parts, labour, panel performance, battery retained capacity, energy throughput, firmware access and who pays to remove and replace a failed device.
- Will monitoring stay accessible? Establish whether local metering, API/Modbus access and inverter telemetry are documented and permitted, and whether an annual portal fee is likely.
- How is the financial comparison made? Ask for the current import and export tariffs, five-year cost lines, at least two sensitivity cases and a clearly separate battery-upgrade calculation.
Compare at least three qualified installer quotes on the same electrical and performance specification. UK readers should check current MCS and SEG eligibility details, export-meter requirements and local distribution network approvals, rather than assuming any installer or system automatically qualifies for a given export contract. International readers must replace the UK assumptions and approvals with their jurisdiction’s rules.
How to recreate the model in a spreadsheet
A simple worksheet is more useful than a calculator that gives a single polished “payback” number without showing its assumptions. Create columns for years 1–15 or 1–25, but mark the five-year reporting window separately. Put all tariff and ageing assumptions in named input cells. Add columns for annual PV production, direct PV consumption, solar sent into battery, delivered battery energy, grid imports, grid exports, electricity bill, operation allowance, replacement costs, installation cost (year zero only), and cumulative net cash outlay.
For year n, let PV_n = PV_1 × (1 − degradation)^(n − 1) and BatteryCharge_n = Charge_1 × PV_n/PV_1 × (1 − battery_throughput_decline)^(n − 1). Let BatteryDelivered_n = BatteryCharge_n × round_trip_efficiency; GridImport_n = HouseholdDemand_n − DirectPV_n − BatteryDelivered_n; and GridExport_n = PV_n − DirectPV_n − BatteryCharge_n. The rows must never produce negative imports or exports; if they do, cap flows by physical availability and revise the dispatch schedule. Add import tariff by time interval where appropriate, rather than using an annual average when cheap and expensive hours matter.
For a bill-to-model reconciliation, start with a full utility statement and the solar meter’s registered total. If estimated home consumption comes from PV generation + grid import − grid export, it may need adjustment for battery charging and discharging depending on which measurements are included in the PV figure. Document the physical meter locations and use a consistent energy-flow definition. The simplest consumer check is that every kWh used, stored, lost and exported has exactly one place in the energy balance.
You can run a sensitivity matrix varying import price, export price, yield, self-consumption, battery throughput, maintenance and backup cost. Check the model at extremely high export prices and at zero solar surplus: the battery should not magically generate savings in those cases. Use a discounted cash-flow rate if comparing the solar installation against an investment alternative, and keep financing costs separate to avoid double counting.
Frequently asked questions
Is a five-year ownership total a five-year ROI?
No. Ownership cost sums installation and running cash outflows within the period, usually net of export revenue. ROI compares an investment’s benefits with its cost, ideally over an economically meaningful life and at a stated discount rate. The equipment still has value after five years, so a five-year cash-outlay number cannot tell the whole lifetime story.
Should I buy a larger battery because its price per kWh is lower?
Only if that capacity addresses real excess solar generation, future off-peak charging opportunities or your backup needs. A larger battery’s £/nominal-kWh sticker price can look attractive while its actual annual utilisation is lower. Compare delivered useful kWh, power rating, warranty throughput and the incremental installed cost.
Are professional solar-panel cleaning visits needed every year?
Not automatically. Roof angle, rain, nearby trees, dust and local conditions matter. Energy Saving Trust notes that rainfall often keeps suitably tilted UK panels clean. Use a periodic condition and performance check instead of inserting an annual cleaning fee solely to justify a maintenance contract.
Does having a battery mean the house works during an outage?
No. Backup requires approved system functionality, protective hardware, correctly configured circuits and an appropriate changeover design. A battery connected to a normal grid-tied inverter may not be capable of supporting any household circuits after grid loss.
Is the export tariff fixed for five years?
Only if you have an actual contract whose terms guarantee it. Ofgem notes that SEG providers set their own rates and terms. Recalculate whenever your import tariff, export scheme, settlement rule or eligibility changes.
Is a smart home dashboard essential?
No. A solar installation must operate safely through its certified inverter, protection and metering regardless of whether Home Assistant is running. A dashboard can provide better observability and help you adjust flexible consumption, but it should not become a single point of failure for safety or battery management.
Verdict: how we would choose
Best cost-first starting point: compare a well-specified solar-only installation with a site-specific generation forecast and a documented export tariff. It gives a clean benchmark for every later upgrade.
Best reason to add a small battery: measured surplus generation, substantial evening/peak consumption and a realistic tariff spread, with a validated estimate of delivered annual kWh. Evaluate the extra battery cost against the extra battery benefit.
Best reason to pay for larger storage and backup: a concrete resilience requirement or a future load profile that smaller storage cannot meet. Obtain a professionally engineered backed-up circuit schedule and price it as a separate option.
A five-year table makes hidden expenses visible; it should never imply that all system designs, roof yields, tariffs and household preferences lead to the same winner. Use your own quotes and bills before making a purchase. The biggest financial error is usually not the cost of a small monitoring device; it is double counting the benefits of energy already generated by the solar panels.
Sources and further reading
- Energy Saving Trust — Solar panels: costs, savings and benefits: installation scope, lifetime, inverters, basic maintenance and monitoring.
- Energy Saving Trust — Battery storage: costs, typical lifetimes, round-trip losses and real-world battery value.
- Energy Saving Trust — Supporting households with low-carbon technology and smart tariff combinations (July 2026): tariff sensitivity and technology interactions.
- Ofgem — Smart Export Guarantee guidance for generators: export eligibility, variable tariff terms and export payment rules.
- NREL / National Laboratory of the Rockies — PVWatts calculator: site-specific solar-energy estimates, system losses and expected production.
Editorial and pricing note (October 2026): The quoted example system totals, standing assumptions and yearly operating budgets are constructed illustrations, not live UK equipment prices or representations of any contractor’s offer. Manufacturer support, tariffs and regulations may change. All electrical work, including battery and backup connections, should be designed and installed by an appropriately qualified professional.