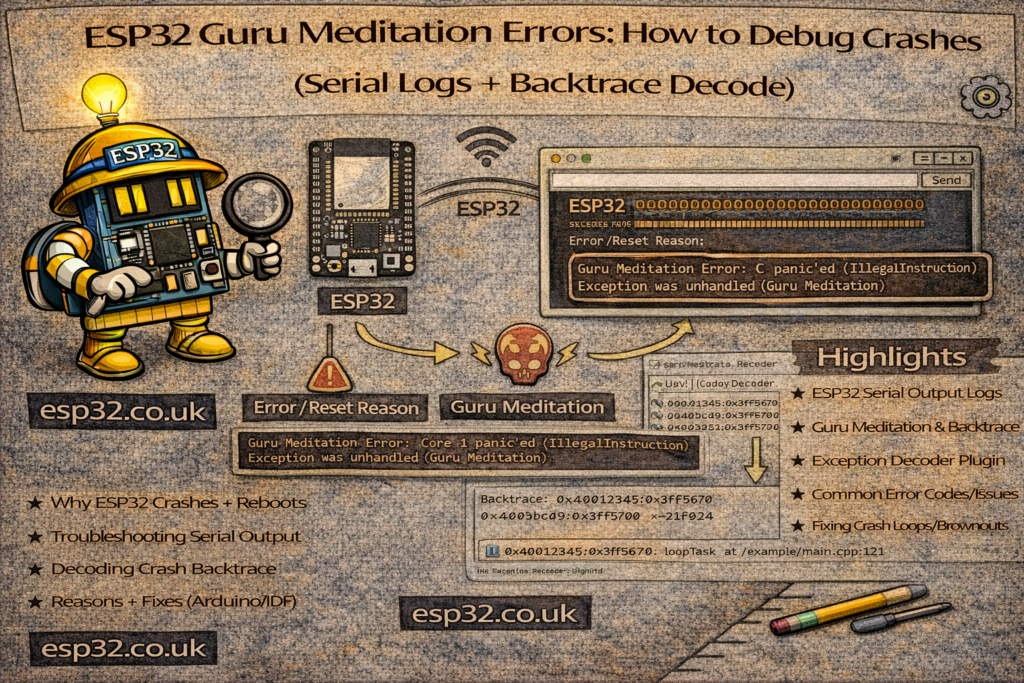
When an ESP32 randomly resets, freezes, or shows a “Guru Meditation Error”, one of the simplest and most effective ways to find the problem is to log progress to the Serial Monitor.
The idea is very basic:
Add
Serial.println("Line X");after every line (or block) that might cause trouble.
Then check which “Line X” is the last one printed before the ESP32 crashes.
This is called instrumenting your code and it’s often enough to pinpoint the exact spot where things break.
1. Basic setup: enable Serial logging
First, you need Serial logging enabled in setup():
void setup() {
  Serial.begin(115200);  // Start serial at 115200 baud
  delay(1000);           // Give the USB serial some time to connect
  Serial.println();
  Serial.println("Booting...");
}
Open the Serial Monitor at 115200 baud so you can see the output.
2. The simplest example: increase a counter and print it
Let’s start with a tiny example where we increase a counter and print it to Serial.
int counter = 0;

void setup() {
  Serial.begin(115200);
  delay(1000);
  Serial.println();
  Serial.println("Booting...");
}

void loop() {
  counter++;  // increase counter

  Serial.print("Counter value: ");
  Serial.println(counter);

  delay(500); // slow things down so we can read the output
}
This code does nothing fancy: it just increments counter and prints the value every 500 ms.
Now let’s see how to apply the “Line X” debugging pattern.
3. Adding Serial.println("Line X") to locate crashes
Imagine you have a more complex loop() and the ESP32 crashes sometimes. You suspect that something inside loop() is causing it, but you don’t know exactly where.
We’ll use an example that deliberately crashes when the counter reaches 10, just to demonstrate the method:
int counter = 0;

void setup() {
  Serial.begin(115200);
  delay(1000);
  Serial.println();
  Serial.println("Booting...");
}

void loop() {
  Serial.println("Line 1: loop start");

  counter++;
  Serial.print("Line 2: counter = ");
  Serial.println(counter);

  // Some "suspicious" block that might cause a crash
  Serial.println("Line 3: before crash-prone code");

  if (counter == 10) {
    Serial.println("Line 4: about to do something dangerous");

    int *ptr = nullptr;      // null pointer (bug)
    *ptr = 123;              // CRASH HERE

    Serial.println("Line 5: after dangerous code (will never print)");
  }

  Serial.println("Line 6: end of loop");
  delay(500);
}
What happens:
- For
counter = 1to9, everything runs fine. - When
counterbecomes 10, we hit theif (counter == 10)block. - We dereference a null pointer (
*ptr = 123;) which will cause a crash (Guru Meditation).
In the Serial Monitor you might see something like:
Line 1: loop start
Line 2: counter = 9
Line 3: before crash-prone code
Line 6: end of loop
Line 1: loop start
Line 2: counter = 10
Line 3: before crash-prone code
Line 4: about to do something dangerous
↳ CRASH (no more lines)
Notice:
- You see up to “Line 4: about to do something dangerous”,
- But you never see “Line 5: after dangerous code”.
Therefore the crash happens between Line 4 and Line 5 → specifically on the *ptr = 123; line.
That’s the essence of this method.
4. How to apply this to real projects
In a real ESP32 project you don’t deliberately crash the code — you just get unexpected resets or Guru Meditation errors.
The debugging steps are the same:
- Pick the suspicious area
For example, the part where you:- Access a sensor
- Manipulate arrays
- Work with pointers or dynamic memory
- Use Wi-Fi, MQTT, SPI, I²C, etc.
- Add line markers before and after each risky line / block For example:
Serial.println("Line A: before reading sensor"); readSensor(); // might cause issues Serial.println("Line B: after reading sensor"); Serial.println("Line C: before sending MQTT"); sendMqttMessage(); // might cause issues Serial.println("Line D: after sending MQTT"); - Observe the last line printed before the crash
- If you see “Line A” but not “Line B”, the crash is inside
readSensor(). - If you see “Line B” and “Line C” but not “Line D”, the crash is inside
sendMqttMessage().
- If you see “Line A” but not “Line B”, the crash is inside
- Go inside the suspicious function and repeat
- Inside
readSensor()add moreSerial.println("X1"),("X2"), etc. - Narrow down until you hit the exact line.
- Inside
5. Tips to keep output readable
A few small habits make your debug logs much easier to understand:
5.1 Use unique labels
Avoid reusing the same text everywhere. Instead of:
Serial.println("line");
Serial.println("line");
Serial.println("line");
Use:
Serial.println("L1: begin loop");
Serial.println("L2: sensor read OK");
Serial.println("L3: preparing data");
Serial.println("L4: sending over WiFi");
So when you scroll in the Serial Monitor, you instantly know where it stopped.
5.2 Include variable values
Printing just Line 1, Line 2, Line 3 helps, but printing usually both label + value is better:
Serial.print("L2: counter = ");
Serial.println(counter);
This way, if the crash happens only when counter = 37, you see that pattern.
5.3 Don’t spam inside very tight loops
If you print inside a loop that runs thousands of times per second, you may flood the serial buffer and slow everything down.
For high-frequency code, print only occasionally:
if (counter % 1000 == 0) {
  Serial.print("L5: counter = ");
  Serial.println(counter);
}
6. Remove or reduce logging in the final version
Once you’ve found and fixed the bug:
- Either comment out the debug prints, or
- Wrap them in a debug macro you can easily turn off later.
Example macro:
#define DEBUG 1

#if DEBUG
  #define DBG(x) Serial.println(x)
#else
  #define DBG(x)
#endif
Then use:
DBG("Line X: something happened");
When you set DEBUG to 0, all those debug messages disappear from the compiled code.
7. Summary
Debugging ESP32 crashes doesn’t have to be complicated:
- Enable Serial logging with
Serial.begin(115200); - Add
Serial.println("Line X");before and after any code that might be risky. - Watch the Serial Monitor and see which “Line X” is the last one printed before the crash.
- Zoom in by adding more prints inside that suspicious area.
With just this simple technique and a few Serial.println("Line X") markers, you can quickly narrow down the exact line that is crashing your ESP32 — even in quite large projects.
